It is critical for investors to benchmark their portfolios for the simple reason that you can validate your strategy. Even if you are meeting your goals, if your benchmark outperforms your portfolio, why not switch to the benchmark? Before we discuss what to do in such a situation, let’s talk about how to select a benchmark and how to benchmark your portfolio EASILY.
What is a Benchmark?
There can be multiple definitions, the simplest being that a point of reference is established to assess or compare against. Your benchmark can be an athlete when it comes to athletic performance or even yourself last month. You use a benchmark to evaluate a goal or a standard.
An appropriate definition in the context of an investment portfolio is to have a pre-established group of investment vehicles behave as a benchmark. A simple benchmark can be any index or ETFs or someone’s portfolio.
These days, the benchmark for many investors and institutions tends to be an index (or a few indexes) as it represents the average. You may think that it’s easy to choose an index but there are many indexes.
Selecting a Portfolio Benchmark
Not all benchmarks are created equal. It’s really important to choose the appropriate benchmark for your portfolio, or you are not helping your case. Numbers can easily be used to tell the story we want it to tell instead of the story it needs to tell.
Investor Portfolios as Benchmark
Wouldn’t it be great if we could compare our portfolio to other like-minded investors? There are some sites that do attempt to do that but I find that it’s not clear if we can trust the sites or how long the portfolios have been established. Comparing a portfolio against a 1-year-old portfolio is not the same as comparing it with a 20-year-old portfolio. It’s also not clear if the portfolios are real or just play money. You just don’t take the same risk when you have your money on the table.
Index as a Benchmark
Aside from comparing with existing portfolios of other investors, we are left with using an index (or set of indexes) to benchmark our portfolio. It is still not an easy task as there are many indexes to choose from. Nevertheless, choosing a set of indexes to benchmark your portfolio is your best option.
Choosing the right set of indexes can still be difficult. BlackRock, for example, tracks 42 indexes ETFs for the Canadian stock market alone.
Selecting Your Benchmark Index
If you have a dividend portfolio, should you compare with the iShares S&P/TSX Canadian Dividend Aristocrats Index ETF or Vanguard Dividend Appreciation (NYSE:VIG) or iShares Canadian Select Dividend Index (XDV ETF)? You might think it’s a good approximation to compare a dividend stock portfolio with a dividend index. You can even do 50/50 between markets. With that said, I do not believe they are an appropriate benchmark.
Let me explain why I don’t believe they are an appropriate benchmark with some financial industry perspective. Mutual funds will seek a benchmark that compares apples to apples with the intention to show investors how their offering performs in order to be selected over the others. They are selling products and want to show they are better than the other products. It makes sense since an investor looking for an apple will want to compare with another apple. It also works well for the mutual fund industry as the manager’s performance is based on how well it does against the benchmark.
As an investor looking to benchmark my portfolio, what is my goal? Identifying your goal is important as it will establish how you should benchmark your portfolio. I am sure you are not trying to sell your strategy, so comparing it with another similar index does what? How does that help you know your investing approach, stock selection or buy timing work?
As a dividend investor, I am tempted to use a dividend index to compare apples to apples but I am not getting a bonus if I do better than the dividend index. You may feel good about it since you beat a professional manager but it does not help you with maximizing your portfolio potential. What we want as investors is to ensure we are doing better than an alternative investment strategy that we put aside.
Here are some Toronto Stock Exchange indexes as examples to see how challenging it could be to pick the right index as a benchmark. The growth of $10,000 after 5 years with the Canadian stock market is outlined below.
- $15,489 – FIE – iShares Canadian Financial Monthly Income ETF
- $14,935 – XIU – iShares S&P/TSX 60 Index ETF
- $13,643 – CDZ – iShares S&P/TSX Canadian Dividend Aristocrats Index ETF
- $13,242 – XDV – iShares Canadian Select Dividend Index ETF
- $12,902 – XEI – iShares S&P/TSX Composite High Dividend Index ETF
- $11,012 – XIC – iShares Core S&P/TSX Capped Composite Index ETF
As a side note, the top 2 indexes are pretty much telling you what investing in the Canadian stock market is about.
The answer to your what is a good benchmark is your alternative investing strategy. Does that seem odd? I hope not because all that is in your power is what you can control, and what you control is how you invest your money.
If you continue to benchmark your portfolio against the Dividend Aristocrats Index for example, and you underperform for years, what are you going to do about it? Drop all of your stocks and buy all the aristocrat stocks? Just buy the index? As you can see above, the S&P/TSX 60 is a much better option then the Canadian Dividend Aristocrats index.
The goal of benchmarking is to improve your portfolio and you need to be ready to change. As such, pick your next strategy or the one you weren’t sure about or simply pick the highly touted couch potato strategy (Indexing model portfolios).
What is your alternative investing strategy?
Mine is indexing with large-cap stocks. So I choose the S&P indexes rather than the selected industry or strategy indexes. That makes my benchmark as follow – no bonds for now but would add some nearing retirement.
- 35% XIU – iShares S&P/TSX 60 Index ETF
- 65% VFV – Vanguard S&P500 Index ETF
- 0% ZAG – BMO Aggregate Bond Index ETF
When the ETFs were created, I had to use different options to ensure the data existed since I started investing. I currently use the following, and you can see the performance below since inception. The calculation provides an Annual Rate of Return (ROR) simulating purchases when I can invest.
- 35% XIU – iShares S&P/TSX 60 Index ETF
- 65% XSP – iShares Core S&P 500 Index ETF

In my retirement years, I can simply withdraw as a drawdown strategy or switch to an income strategy. My preference is income strategy so I would switch it to investments that provide more income. Note that most index ETFs do provide a dividend, but you can switch to REIT indexes and Financial indexes for a higher dividend yield.
Portfolio Benchmark Calculator
As investors, we are looking to validate our strategy, and if it’s not performing, the intention is to adjust and make corrections. The big question is:
How do we know our portfolio is not performing?
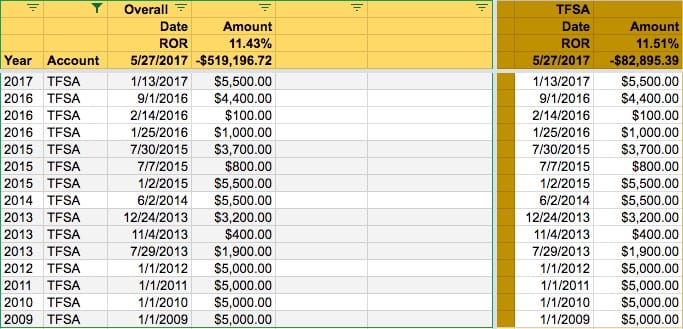
First, you need a spreadsheet to track your portfolio and benchmark performance. It’s a lot simpler than you may think. To create the calculator, you need two sets of data points:
- Your deposit into the accounts
- The total value of each account

I have written a detailed post on “How to calculate your REAL Annual Rate of Return.” If you want the details but fear not, there is a spreadsheet coming your way to help you out. I am not a big fan of the calculations done by discount brokers or financial institutions, as they focus on tax accounting rather than performance accounting.
My concern is due to how DRIP shares are accounted for. For performance accounting, I argue that a DRIP share has no cost as it is re-invested profit, but for tax accounting, there is a share cost that is being tracked due to future capital gains one must pay.
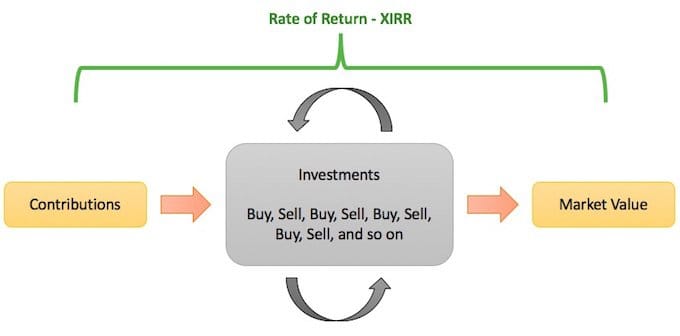
Ultimately, I move away from what happens within the account and focus on what happens with the money going into the accounts and the total value. The accounts are just a compounding machine.

Once you are set up and ready to compare your portfolio, you must decide your tolerance threshold before making changes. If you want to track the benchmark, consider the complete Portfolio Tracker, as it comes with much more than portfolio benchmarking.
What is an Appropriate Benchmark Timeline?
We often hear comparisons to last year or the last twelve months when investors talk about their performance, and I don’t think it’s long enough to make wholesale changes to an investment strategy. At a minimum, you should have three years of data to compare and one full economic cycle to give you the best comparison. The short answer to what consists of a full economic cycle for investors is to have gone through a recession to understand how your portfolio responds.
