One thing that most investors realize quickly is that you can’t get 10% interests at the bank. You hardly get any return on your money. My dad often reminds me how he was investing at above 10% in the early 80’s but then again mortgage rates were also significantly higher…
These days, we need to play the hand that we were dealt which is low-interest rate environment. To get decent returns, you have to invest in equities. That’s where dividends come in to create a compound growth return.
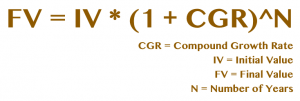
Compound growth is a simple mathematical concept but powerful when you let it ride for many years.
Compound Growth
Compound growth is really a simple formula and the concept is as follow.
The interest earned on your principal is added to your principal to calculate the following year’s interest. Even if you don’t add any more money, your interest is bound to increase year after year since the previous year’s interest is also included in the calculations.
While the definition of compound growth can be written in many ways, it’s essentially a mathematical formula covering a period of time as outlined below. The compound growth rate can simply be the interest rate of an account.
Benefit #1 – Time does a lot of the work
See the example below on the results of compound growth applied to a TFSA account over 30 years. You double all of your contributions at 5% return and you quadruple it at 10% return. Time is magical, no one can buy time. The benefits of compound growth are more prevalent with more money at work. It creates a compounding machine.
| wdt_ID | Year | Yearly Limit | Cumulative | 5% Growth | 10% Growth |
|---|---|---|---|---|---|
| 1 | 2009 | 5,000 | 5,000 | 5,250 | 5,500 |
| 2 | 2010 | 5,000 | 10,000 | 10,762 | 11,550 |
| 3 | 2011 | 5,000 | 15,000 | 16,550 | 18,205 |
| 4 | 2012 | 5,000 | 20,000 | 22,628 | 25,525 |
| 5 | 2013 | 5,500 | 25,500 | 29,534 | 34,128 |
| 6 | 2014 | 5,500 | 31,000 | 36,786 | 43,590 |
| 7 | 2015 | 10,000 | 41,000 | 49,125 | 58,949 |
| 8 | 2016 | 5,500 | 46,500 | 57,356 | 70,984 |
| 9 | 2017 | 5,500 | 52,000 | 65,999 | 84,034 |
| 10 | 2018 | 5,500 | 57,500 | 75,074 | 98,487 |
| 11 | 2019 | 6,000 | 63,500 | 85,128 | 114,986 |
| 12 | 2020 | 6,000 | 69,500 | 95,684 | 133,030 |
| 13 | 2021 | 6,000 | 75,500 | 106,769 | 152,933 |
| 14 | 2022 | 6,000 | 81,500 | 118,407 | 174,827 |
| 15 | 2023 | 6,500 | 88,000 | 131,152 | 199,459 |
| 16 | 2024 | 6,500 | 94,500 | 144,536 | 226,555 |
| 17 | 2025 | 6,500 | 101,000 | 158,587 | 256,361 |
| 18 | 2026 | 6,500 | 107,500 | 173,342 | 289,147 |
| 19 | 2027 | 7,000 | 114,500 | 189,359 | 325,762 |
| 20 | 2028 | 7,000 | 121,500 | 206,177 | 366,038 |
| 21 | 2029 | 7,000 | 128,500 | 223,836 | 410,342 |
| 22 | 2030 | 7,500 | 136,000 | 242,902 | 459,626 |
| 23 | 2031 | 7,500 | 143,500 | 262,923 | 513,838 |
| 24 | 2032 | 7,500 | 151,000 | 283,944 | 573,472 |
| 25 | 2033 | 7,500 | 158,500 | 306,016 | 639,069 |
| 26 | 2034 | 7,500 | 166,000 | 329,192 | 711,226 |
| 27 | 2035 | 7,500 | 173,500 | 353,526 | 790,599 |
| 28 | 2036 | 7,500 | 181,000 | 379,078 | 877,909 |
| 29 | 2037 | 7,500 | 188,500 | 405,906 | 973,950 |
| 30 | 2038 | 7,500 | 196,000 | 434,077 | 1,079,595 |
Time is the variable you cannot impact aside from starting early. Don’t delay.
Benefit #2 – Make it work for you
You might be really interested in buying high yield stocks with 5% yield or more but that might not be the right choice. When it comes to stock, dividend growth stocks with DRIP allow you to benefit from compound growth while you sleep but you do not want to ignore growth from a dividend growth stock versus a high yield stock. The end game is total return for a higher annual rate of return. Compounding your dividend is part of the portfolio growth formula. A great way to estimate this growth is the Chowder Score.
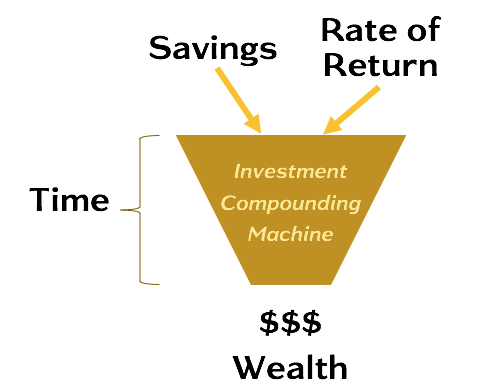
The wealth triangle shows you the pillars of building wealth with your savings invested, a rate of return and time. Time is not really in your control but the other 2 variables are. Choose your investment wisely as it sets the rate of return you will receive.
While the savings is really a factor of your personal finance, the rate of return is in your hands based on your investing strategy and the dividend triangle shows you that dividend growth leads to higher total returns. Imagine that your growth rate can grow by 10% annually, as seen below.
| wdt_ID | Year | Yearly Limit | Cumulative | 5% Growth | 10% Growth |
|---|---|---|---|---|---|
| 1 | 2009 | 5,000 | 5,000 | 5,250 | 5,500 |
| 2 | 2010 | 5,000 | 10,000 | 10,762 | 11,550 |
| 3 | 2011 | 5,000 | 15,000 | 16,550 | 18,205 |
| 4 | 2012 | 5,000 | 20,000 | 22,628 | 25,525 |
| 5 | 2013 | 5,500 | 25,500 | 29,534 | 34,128 |
| 6 | 2014 | 5,500 | 31,000 | 36,786 | 43,590 |
| 7 | 2015 | 10,000 | 41,000 | 49,125 | 58,949 |
| 8 | 2016 | 5,500 | 46,500 | 57,356 | 70,984 |
| 9 | 2017 | 5,500 | 52,000 | 65,999 | 84,034 |
| 10 | 2018 | 5,500 | 57,500 | 75,074 | 98,487 |
| 11 | 2019 | 6,000 | 63,500 | 85,128 | 114,986 |
| 12 | 2020 | 6,000 | 69,500 | 95,684 | 133,030 |
| 13 | 2021 | 6,000 | 75,500 | 106,769 | 152,933 |
| 14 | 2022 | 6,000 | 81,500 | 118,407 | 174,827 |
| 15 | 2023 | 6,500 | 88,000 | 131,152 | 199,459 |
| 16 | 2024 | 6,500 | 94,500 | 144,536 | 226,555 |
| 17 | 2025 | 6,500 | 101,000 | 158,587 | 256,361 |
| 18 | 2026 | 6,500 | 107,500 | 173,342 | 289,147 |
| 19 | 2027 | 7,000 | 114,500 | 189,359 | 325,762 |
| 20 | 2028 | 7,000 | 121,500 | 206,177 | 366,038 |
| 21 | 2029 | 7,000 | 128,500 | 223,836 | 410,342 |
| 22 | 2030 | 7,500 | 136,000 | 242,902 | 459,626 |
| 23 | 2031 | 7,500 | 143,500 | 262,923 | 513,838 |
| 24 | 2032 | 7,500 | 151,000 | 283,944 | 573,472 |
| 25 | 2033 | 7,500 | 158,500 | 306,016 | 639,069 |
| 26 | 2034 | 7,500 | 166,000 | 329,192 | 711,226 |
| 27 | 2035 | 7,500 | 173,500 | 353,526 | 790,599 |
| 28 | 2036 | 7,500 | 181,000 | 379,078 | 877,909 |
| 29 | 2037 | 7,500 | 188,500 | 405,906 | 973,950 |
| 30 | 2038 | 7,500 | 196,000 | 434,077 | 1,079,595 |
Benefit #3 – Compounding Dividend Growth
Compounding is where the magic happens to give you an extra boost. When I do the math on my investments and compare with and without DRIP for the rate of return, I can see a 1% to 2% difference which is significant over time especially when you have a solid dividend growth stocks as the dividend increases every year and therefore so does the DRIP.
The only gotcha here is that you need to reach a volume high enough to DRIP a few shares as really strong dividend growth stocks will also increase in price which can make the DRIP a little harder.
Rule of 72
The rule of 72 is a simple rule of thumb to estimate how fast your money will double. You basically divide 72 by the interest rate (or growth rate) you have and it estimates the number of years it would take to double your initial capital. In my case, the growth rate is my dividend yield. To ensure you get the results, your dividend must be reinvested as the rule assumes compound growth.
When you can figure out your compound annual growth rate, you can use it to assess how fast you can double your portfolio. They say the first million is the hardest, that’s because it takes less time to double the second one.
Compound Annual Growth Rate or CAGR
Great dividend stocks happen to increase their dividend annually and some by 10%, such as the dividend ambassadors, and that makes it a bit harder to calculate the annual growth rate or the actual growth rate.
The Compound Annual Growth Rate (CAGR) which establishes your annual rate of return is what comes into play to derive the actual rate of return. CAGR is also known as XIRR in Excel (or other spreadsheets). It takes into account when you started the calculation, the amounts added/withdrawn over time and the current amount you have now to calculate your annual return.
The simplest way to calculate your CAGR is to use a spreadsheet and use the built-in XIRR formula. You will need your investment account contributions and withdrawals with the dates as well as the current value of the account. To simplify my process, I put together a portfolio tracker to know exactly the performance of each of my accounts as well as my portfolio.